COVID-19 Early Detection Levels
Updated 1/11/2023
This tool highlights trends in our different COVID-19 detection systems prior to significant case increases or increases in patients in the hospital systems. It is a supplement to the CDC Community Levels and can be used when COVID-19 spread is increasing but still at low levels. The system uses a scale from 0-4, with 0 meaning there are no metrics suggesting cases will increase in the near future, while 4 means the metrics suggest cases will increase in the near future. Once a 4 is reached, we recommend checking the CDC Community Levels to know what actions may need to be taken to reduce the risk of COVID-19.
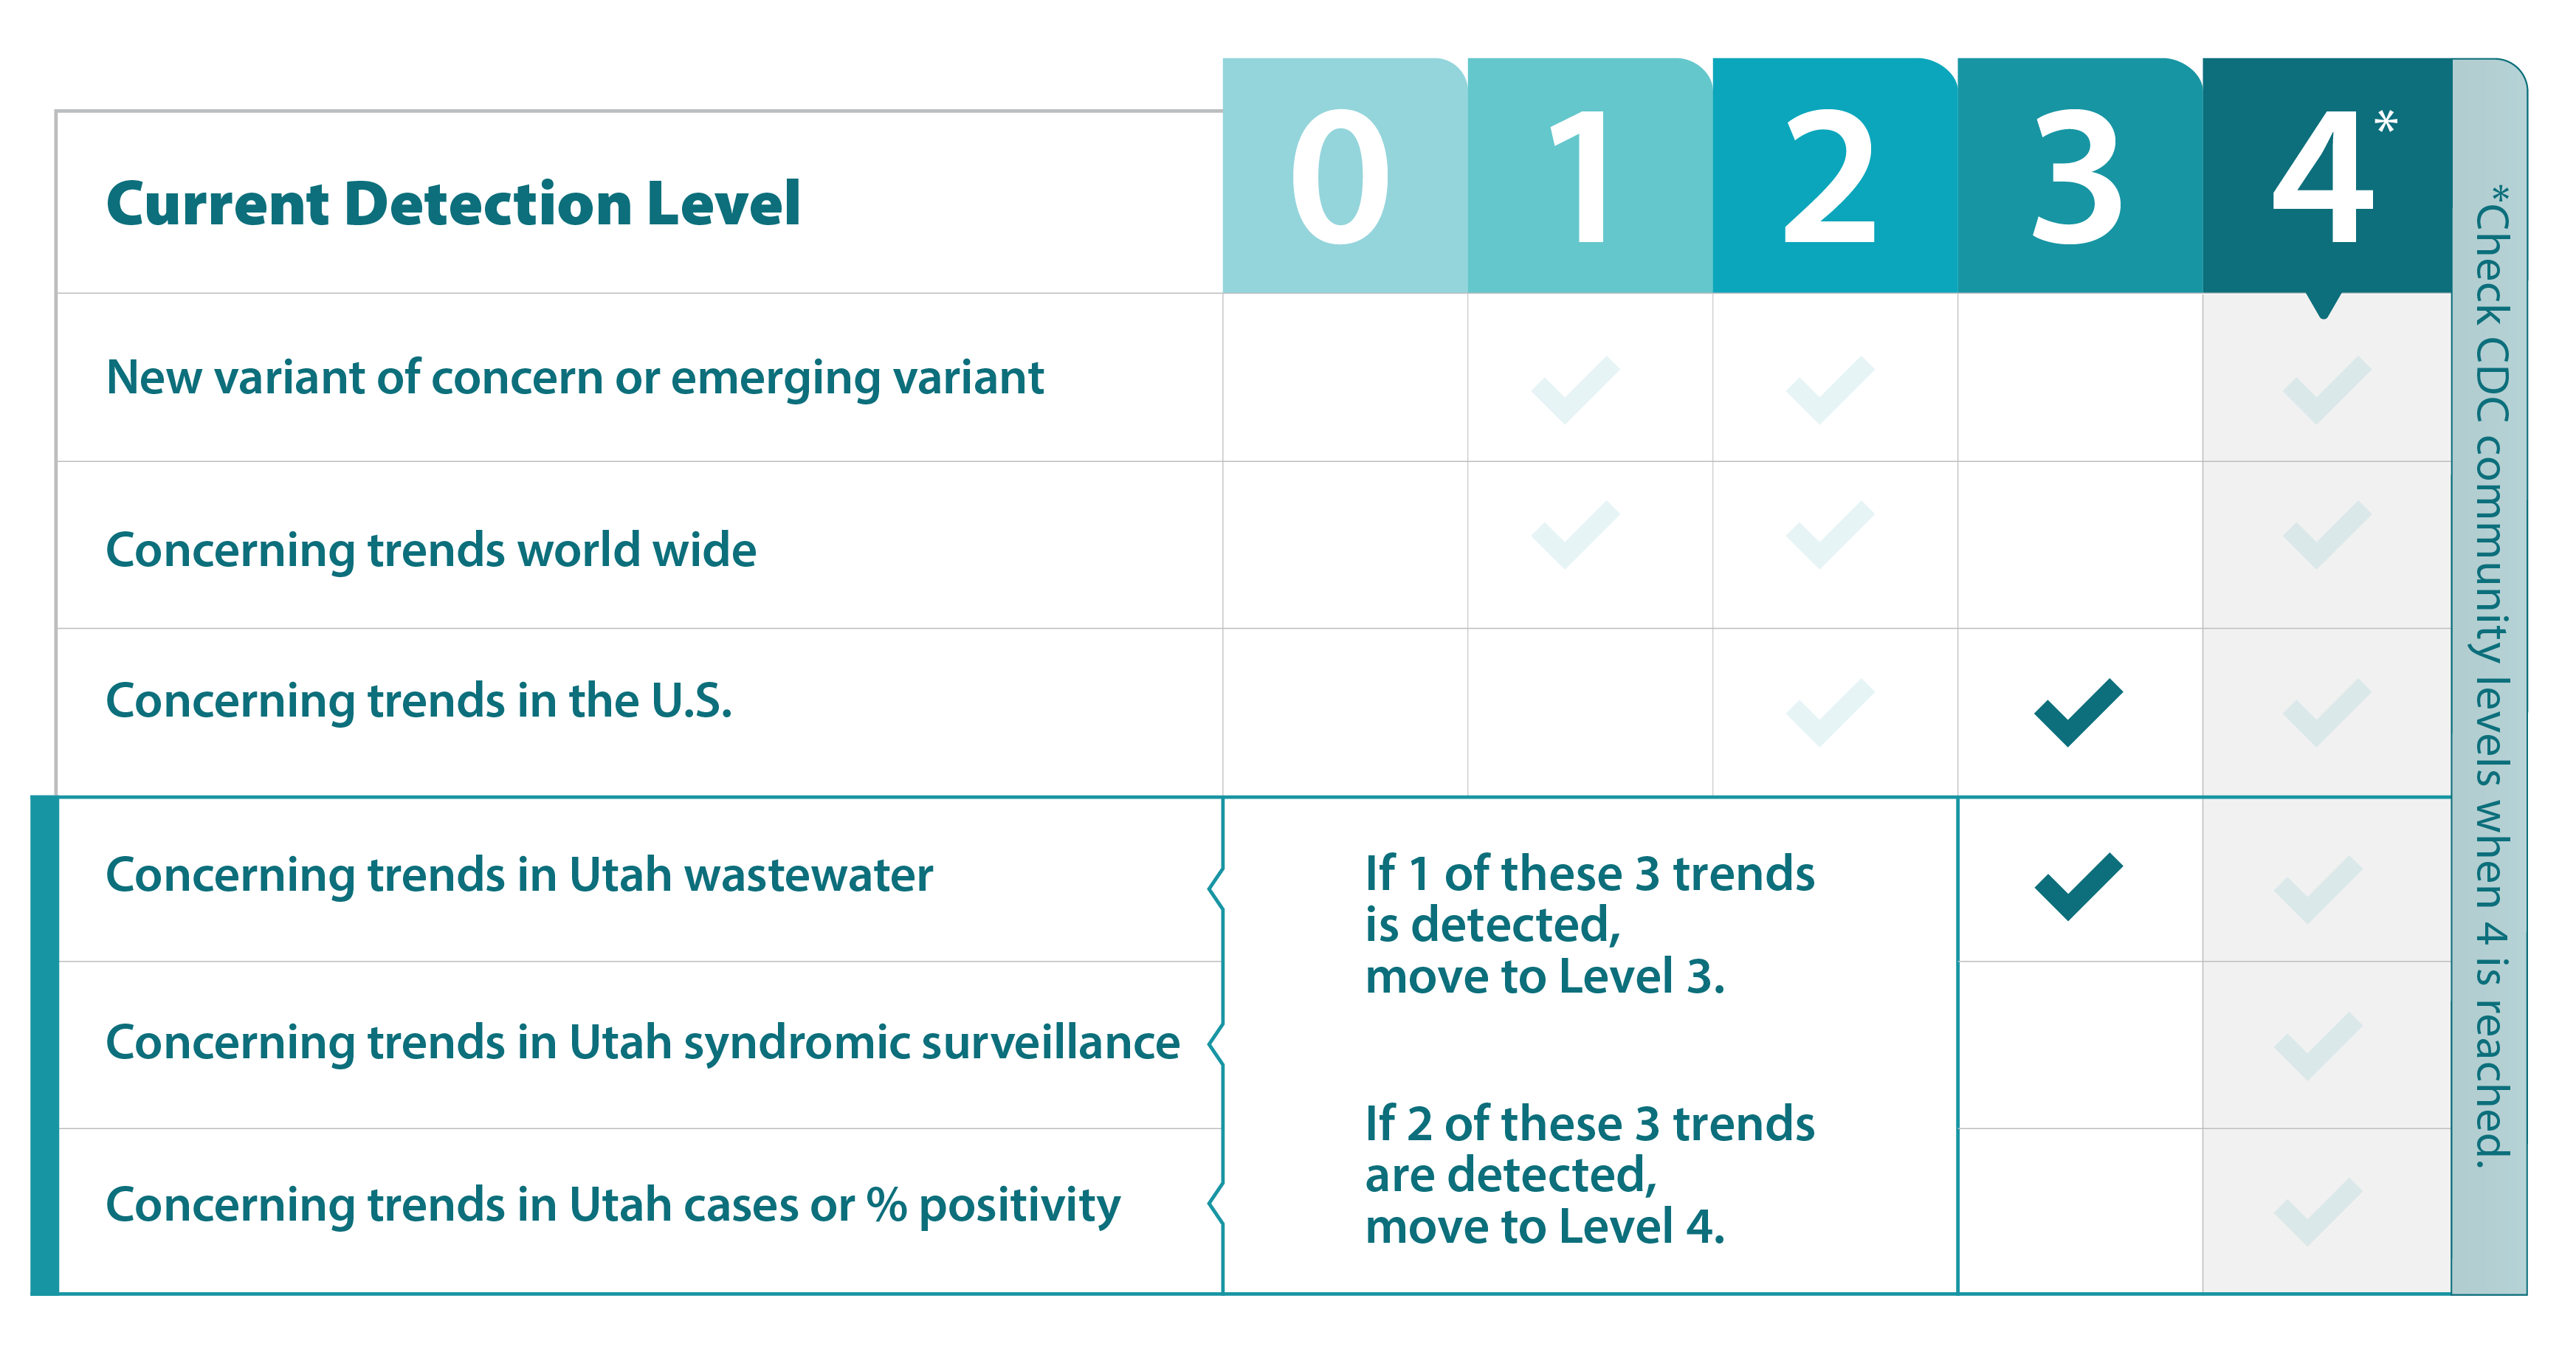
Check CDC community levels for your county when level 4 is reached.
Glossary, indicator and current status
New VOC or emerging variant
Detection of a variant that is related to or expected to cause an increase in transmission, cases, or severity.
There are multiple variants of concern with mutations that allow them to avoid treatment as well as increase transmission (e.g. BQ.1, BQ.1.1, XBB.1.5). While these are expanding rapidly there is not evidence that these are causing dramatic increases in infection or severity.
Concerning trends world wide
Increasing transmission, cases, or severity internationally.
Multiple countries with fluctuations and increases but no significant waves. China is having a significant increase in cases, however this is due to changing behavior, not a new variant.
Concerning trends in U.S.
Increasing transmission, cases, or severity in the U.S.

Increase in hospitalizations seen in many parts of the country. National wastewater data suggests significant increase in undetected cases.
Concerning trends in Utah wastewater
Three or more wastewater sites in Utah that are at or above the normal range.
Due to abbreviated holiday sampling, trends are currently not able to be determined. However, we are seeing increases again in some areas (prior to the holidays levels were generally trending down). In particular, sites in Summit and Wasatch counties are seeing very high levels (which could be at least in part due to recreation and tourism). (Last Updated: 1/11/2023)
Concerning trends in Utah syndromic surveillance
An increase over time of emergency room visits for COVID-19.
Statewide 7-day average of the percent of ED visits is currently in a decreasing phase as of 12/5/2022 and is currently at 2.32%. This includes 12/13 LHDs in a decreasing trend with only Wasatch in an increasing trend. (Last Updated: 1/11/2023)
Concerning trends in Utah cases or % positivity
An increase of COVID-19 cases or the percent positivity is greater than or equal to 10% of people being tested.
The statewide three-day incidence has continued in its decreasing trend phase as of 12/3/22. Percent positivity (person/person) has been decreasing since reporting 21.25% on 11/28/2022 where we are at 13.86% as of 1/8/2023. (Last Updated: 1/11/2023)
Use of different systems
Best used when:
There are low levels of COVID-19 in a community.
Best used to:
Detect changes before there is a significant impact on a community.
Best used when:
There are medium or high levels of COVID-19 in a community.
Best used to:
Guide prevention approaches for people in high-risk settings.
Best used when:
There are high levels of COVID-19 in a community.
Best used to:
Inform the general public when and how to protect themselves from COVID-19.
The CDC Community Levels tool uses data to identify when a community is facing a lower, moderate, or high risk from COVID-19. The CDC Community Levels tool is less sensitive than the Early Detection System shown here, and should be used as a guide to what protective behaviors are most appropriate.