
We have been using percent positivity as a leading indicator since the beginning of the pandemic. That means that it helps us predict the direction cases are going. If we have a high percent of positive cases that is trending upwards, that means we can expect COVID-19 is spreading quickly. A low percent of positive cases that is trending downward means that we are slowing it down.
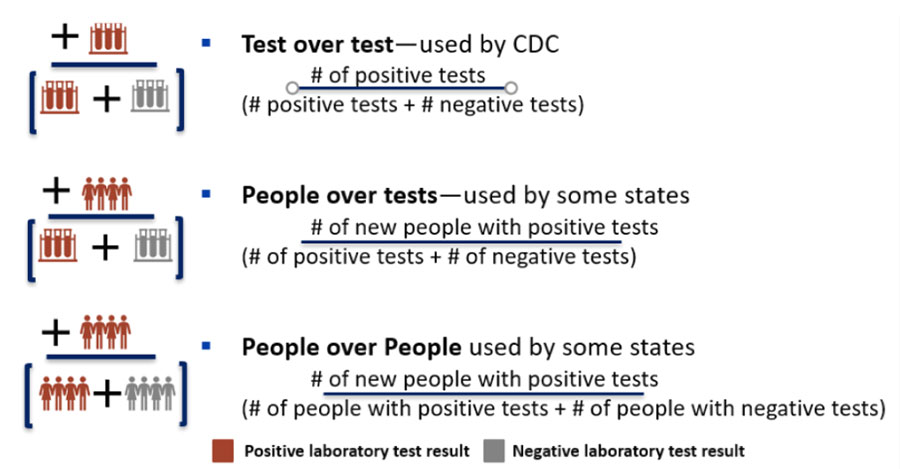
The Centers for Disease Control and Prevention (CDC) says there are three options for calculating percent positivity. All three are good, though each tells a slightly different story. States are free to choose the method they want based on the quality of their data.
Utah’s current method
(It’s not going anywhere)
We call our method “people over people” and it looks like this:
Total number of people who tested positive
Total number of unique people tested
In this method, we only count a person’s first positive test. If they don’t have a positive test, we count their first negative test. Early in the pandemic, some people were getting retested with PCR tests, though this wasn’t happening very often, and would continue testing positive. It’s not right to continue counting them as additional positive cases.
With repeat testing, a person’s test result could be counted again, but only after 90 days.
Tracking the number of people tested helps us predict a surge in cases. It’s useful for our response and we will continue using it.
But as testing changes, there’s another calculation we need to look at.
Introducing the test over test method
Most states are using this method and it’s time for Utah to start using it, in addition to our current method, and this new method will be displayed on our public data dashboard. In the fall, we started having access to more rapid antigen tests. Between the fall and now, we have conducted a lot of repeat testing of individuals to try and spot COVID-19 cases.
Because rapid antigen tests are less sensitive than other tests, you need to do them more often. Fortunately, rapid antigen tests are conducted with a simple nasal swab and are less invasive than PCR nasopharyngeal swabs. So it’s easier to do that repeat testing.
Our current method of percent positivity doesn’t account for this huge influx of repeat testing. So starting Feb. 8, we are sharing a new percent positivity calculation in addition to the people/people method. It looks like this:
Total positive tests
Total tests conducted
For many months, we have been displaying the number of people tested alongside the number of total tests conducted. The number of total tests is around 1.4 million more than the number of people tested. Because there are so many repeat tests, this new percent positivity calculation will be biased lower than the people/people method. Basically, that means you will see a smaller percent positivity. More on that in a minute.
How to interpret this extra data at your fingertips
Starting the week of Feb. 8, 2021, we are going to display both measures of percent positivity.
This will allow you to compare percent positivity to other states. More than 35 other states currently calculate percent positivity using the test/test method.
When you compare the trends of the two methods, you will see the trends are basically the same, but separated by a number of percentage points.
We want people to get tested. It’s a key intervention, and the test/test method allows us to see the benefits of these efforts.
Just keep in mind that even though the scale is different, the trends are the same. And the trend is more important to us than the actual scale being used.
Q & A
Q: How will this affect the state’s response? Will we still know how many people tested?
A: We will continue showing both numbers.
From a public health response, we will look at both methods.
Q: Recently (2/4/2021), the 7-day rolling average for percent positivity was 16.5 percent. What would that have been with the new method?
A: 7.3 percent
Q: Are you concerned that, with this new calculation of percent positivity, the public could perceive that the pandemic is not as severe?
A: This is why we emphasize not looking at a single metric. We use hospitalizations, case counts and percent positivity to understand what is happening. Percent positivity really tells us if we are doing enough testing. We like to see a decrease in percent positivity. Until now, it hasn’t been easy to compare Utah’s percent positivity to most other states.
Q: We’ve been saying 3-5 percent positivity will indicate the outbreak is under control, what would you say now?
A: That’s still the same.
Q: Why wouldn’t percent positivity to have to be much lower than 3-5 percent positivity have to drop?
A: The people/people method skews high. The test/test method skews low. The truth is somewhere in the middle, but the trend is what we really care about. The 5 percent number we’ve spoken about before is actually using test/test, even though we are displaying people/people.
Q: Are you concerned people will think you’re changing the measure to make the situation look better?
A: This is really just alignment with 35 other states displaying this publicly. And, we will continue to report both measures. It lets us see how great Utah is and takes into account the large numbers of repeat testing we are doing.
Q: If you are deliberately repeatedly testing people, is there a danger of watering down the numbers?
A: The truth is somewhere in the middle of the calculations. But the trend is what is important. We want as much testing as possible because we are more likely to catch someone early in disease and slow spread. We hope to encourage more frequent testing even more.
Q: Will both measurements be displayed on the public dashboard?
A: Yes. And you will be able to see how the trend looked a year ago. Early on, we were repeat testing the positives and now we’re repeat testing the negatives. That way, if someone becomes positive, we can catch them quickly.
Q: How long has this been in discussion?
A: We’ve been looking at this for a couple of months to see how the influx of rapid testing has changed our testing landscape.
We knew that once we started using millions of rapid antigen tests with regular repeat testing, it was going to affect our percent positivity.
Q: It seems vaccines are the current hot topic. What role does testing still play?
A: We are excited about vaccinations and their availability. But we can’t rely solely on vaccines as a prevention effort yet. We have at least 6 more months of pandemic response. We need to continue to identify people really early, conduct contact tracing and get people in quarantine or isolation. More testing is more likely to catch people before they go to an event and spread. These new variants of COVID-19 are more transmissible. The only way to let them spread is giving them a playground. We have to continue to mask, distance and test to slow the virus’s spread.
Q: What states are currently using test/test?
A: Alabama, Alaska, Arizona, Arkansas, California, Connecticut, Georgia, Hawaii, Idaho, Indiana, Kansas, Louisiana, Maine, Maryland, Massachusetts, Michigan, Minnesota, Missouri, Nebraska, Nevada, New Hampshire, New Jersey, New York, North Carolina, Ohio, Oklahoma, Oregon, Rhode Island, South Dakota, Tennessee, Virginia, Washington, West Virginia, Wyoming. It’s impossible to determine what a handful of other states are using, but we suspect it’s test/test.
Q: What other states are using people/people?
A: Florida, Iowa, Kentucky, Mississippi
Q: Does anyone report both?
A: Delaware and Wisconsin.
Q: With the people/people method, you are currently only counting a person’s test result once in 90 days. Do you do that with test/test?
A: No.
Q: Will you still report a rolling 7-day average for percent positivity?
A: Yes. One day does not make a trend. We are still at the risk for another surge. It will still be several more months before we are home free.