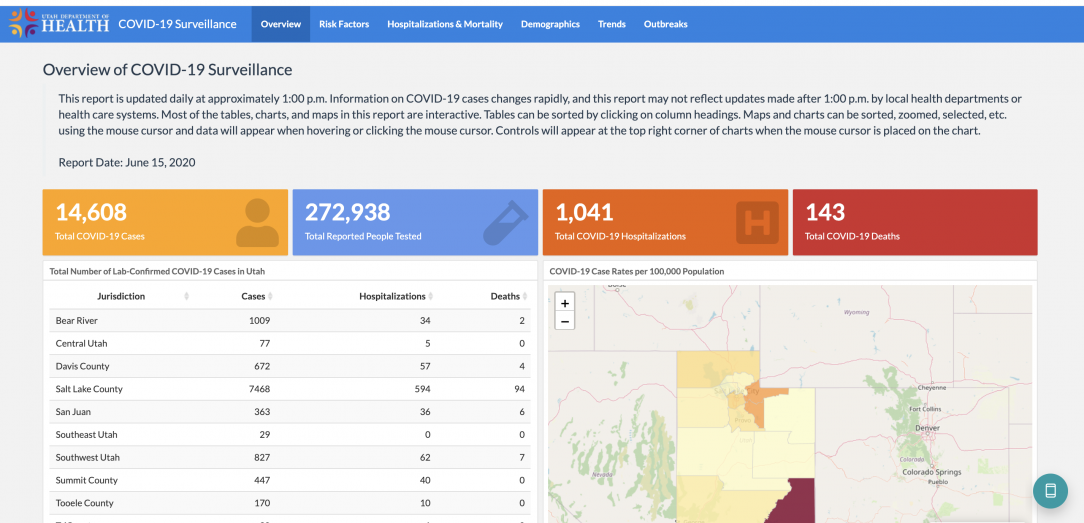
(June 15, 2020) – Today the Utah Department of Health made several changes to the case counts dashboard. Those who access the page will find that two tabs have been renamed. “Incidence & Epicurve” is now “Trends” and “Care Facilities” is now “Outbreaks.” These changes have been made to make these tabs more broad in description and allow for additional data to be included in these sections.
In addition to the tab name changes the following changes have been made:
- Overview tab: A line graphs have been added for cases by local health department. Additionally, a map showing cases by health district has been removed. (This information is still displayed in the chart to the left.)
- Risk Factors tab: A bar chart has been added for pre-existing conditions of all cases by age.
- Hospitalization & Mortality tab: New data has been added to the charts in this section: ICU/non-ICU bed use, ventilator use, hospital summary stats (male/female, average age, median age, percent 65+ years, pre-existing conditions, percent high risk). Also, daily hospital survey data is now in a bar chart to show ICU/non-ICU bed use.
- Trends tab: A new bar chart has been added to show a seven-day rolling average of COVID-19 cases by the date a positive case was reported to public health.
- Two new sections have been added – Laboratory Testing Trends (bar chart) and Syndromic Surveillance Trends (line graph).
- Outbreaks tab:
- One new section has been added – Other Outbreaks (new table that shows outbreaks in areas outside long-term care facilities).

